Performance Monitoring
Performance Monitoring is only available in Crawlab Pro.
Crawlab's Performance Monitoring system provides comprehensive visibility into your web scraping operations, helping you maintain optimal system health and efficiency. This feature tracks critical metrics across your distributed node infrastructure and database connections, enabling quick identification of bottlenecks in compute resources, storage performance, or network throughput.
By monitoring real-time node utilization, database query patterns, and cluster-wide task execution, teams can proactively balance workloads across worker nodes while ensuring database health. The system captures granular data including node-level CPU/memory allocation, database connection pools, task duration distributions, and storage I/O metrics, while preserving historical trends for capacity planning.
These insights empower organizations to optimize their crawling architecture, prevent node resource contention, and maintain consistent data pipeline performance at scale.
Monitor Nodes
Crawlab's node monitoring provides real-time visibility into your distributed crawling infrastructure, enabling optimal resource utilization across master and worker nodes. The system tracks vital health metrics for each node in your cluster, including CPU/memory allocation, network throughput, storage I/O patterns, and task queue depth. This granular monitoring helps identify under-provisioned worker nodes, detect master node bottlenecks, and maintain balanced workloads across your scraping infrastructure.
Key monitoring aspects include:
- Resource Utilization: Track compute-intensive operations through CPU core usage and memory pressure metrics
- Network Performance: Monitor inbound/outbound bandwidth usage and connection success rates between nodes
- Storage Health: Analyze disk I/O latency and storage capacity trends across nodes
By correlating node metrics with task execution patterns, teams can:
- Prevent node overload through predictive capacity planning
- Automatically redistribute tasks from struggling nodes
- Identify hardware limitations affecting scraping performance
- Validate scaling decisions when adding new worker nodes
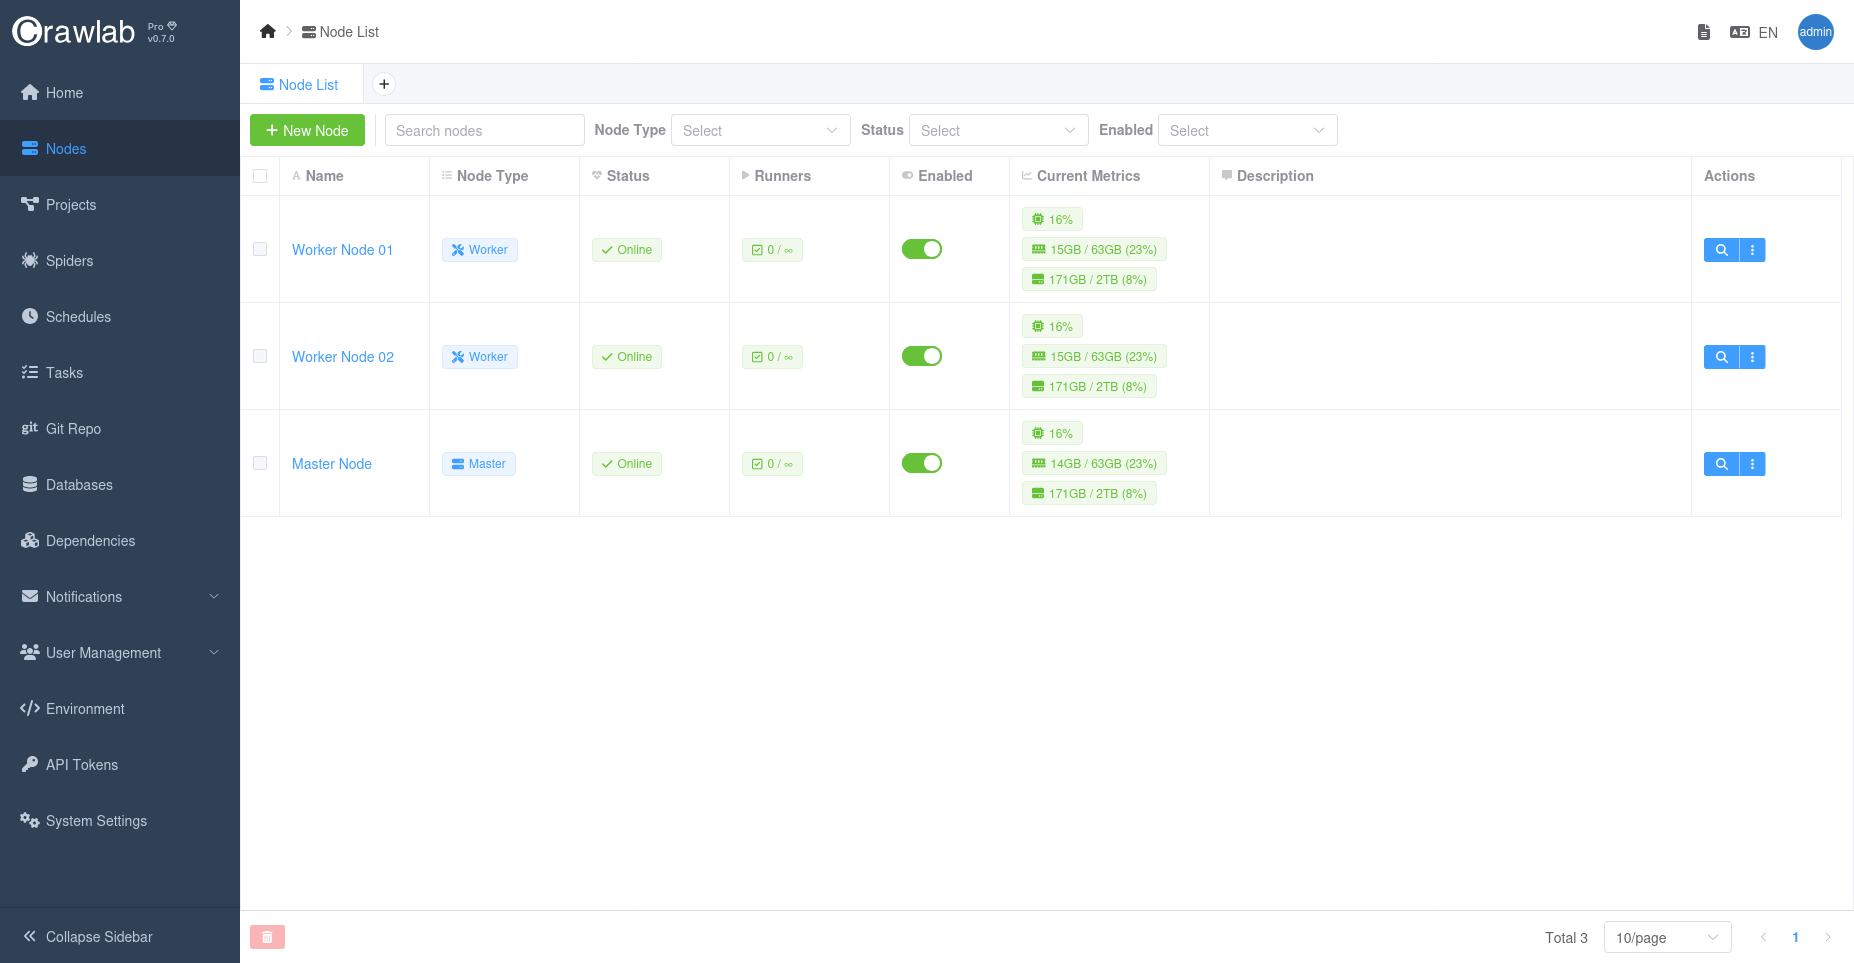
Overall Node Metrics
You can view the overall node metrics in the Nodes list page.
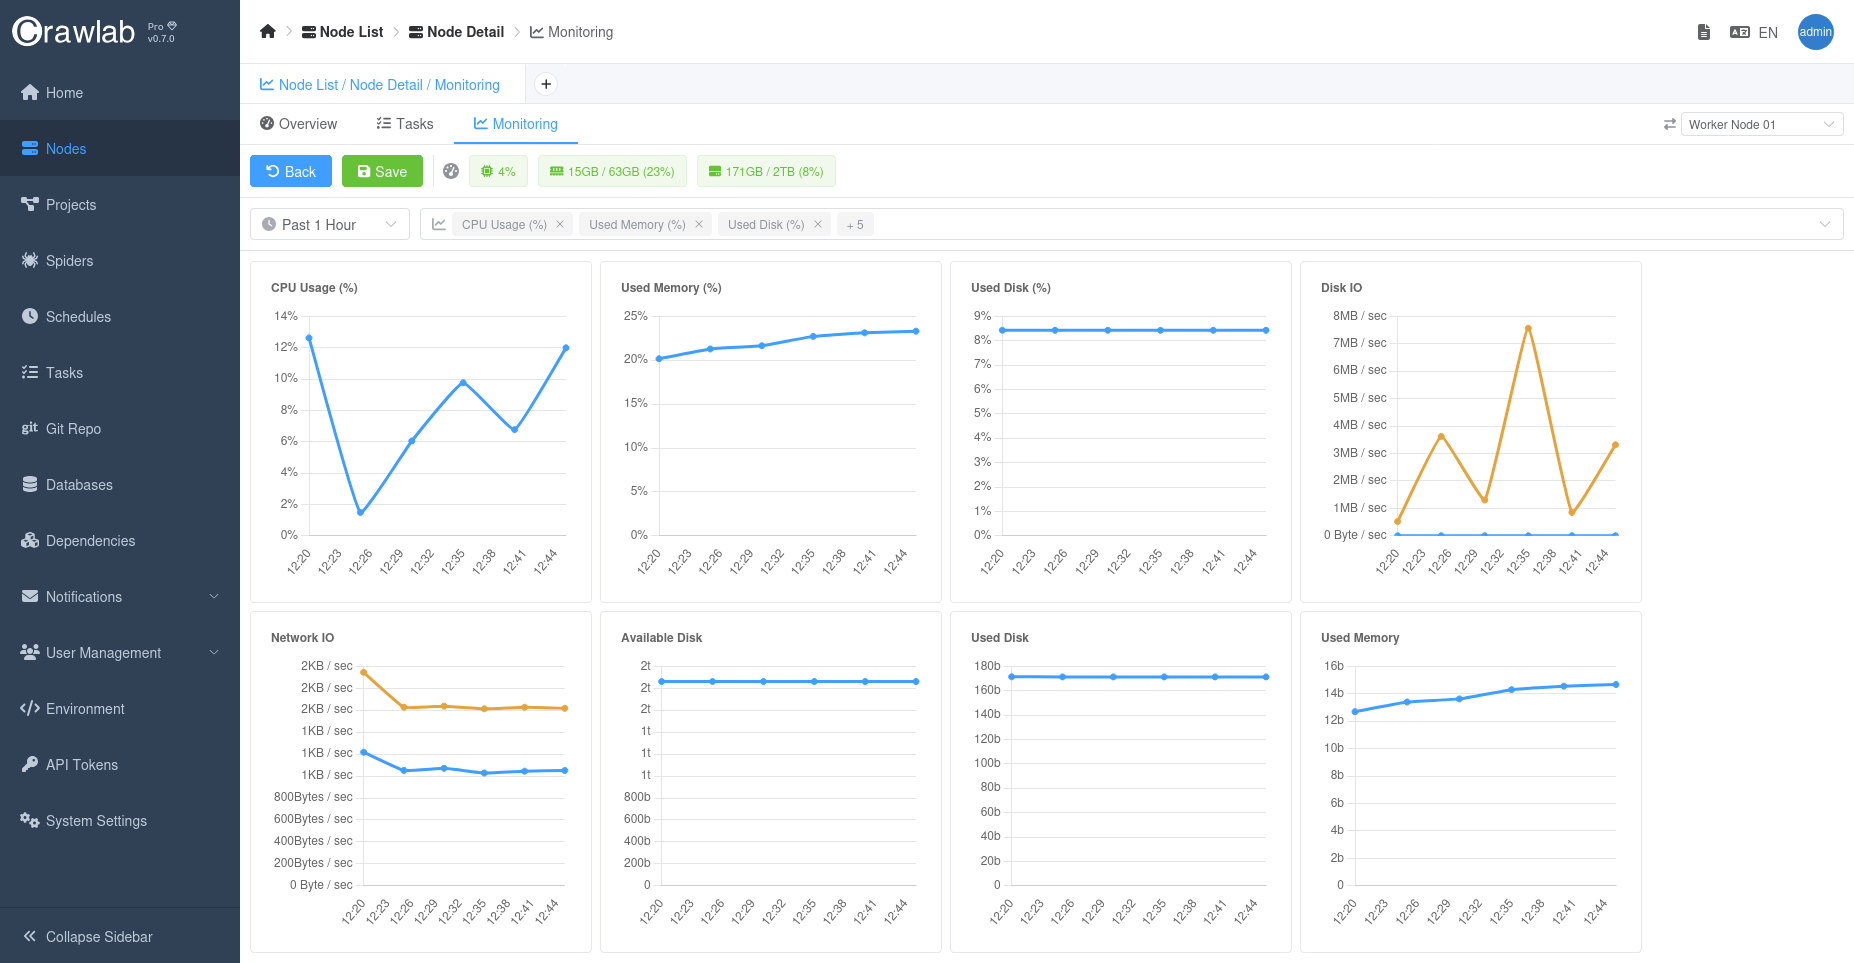
Time Series Node Metrics
For each node, you can view the time series metrics in the Monitoring tab in the Node detail page.
Monitor Databases
Crawlab's database monitoring provides deep visibility into your data pipeline operations, tracking both operational databases and analytical stores. The system analyzes connection pool utilization, query execution patterns, and storage engine performance across supported databases including MongoDB, MySQL, and PostgreSQL. Key metrics include:
- Connection Health: Monitor active connections, connection wait times, and connection pool utilization
- Query Performance: Track slow query thresholds, index usage efficiency, and lock contention patterns
- Storage Metrics: Analyze read/write throughput, cache hit ratios, and replication lag (for clustered deployments)
These insights help teams:
- Identify N+1 query patterns in crawler data pipelines
- Optimize index strategies for frequent lookup operations
- Prevent connection pool exhaustion during peak crawling periods
- Validate database scaling decisions through historical trend analysis
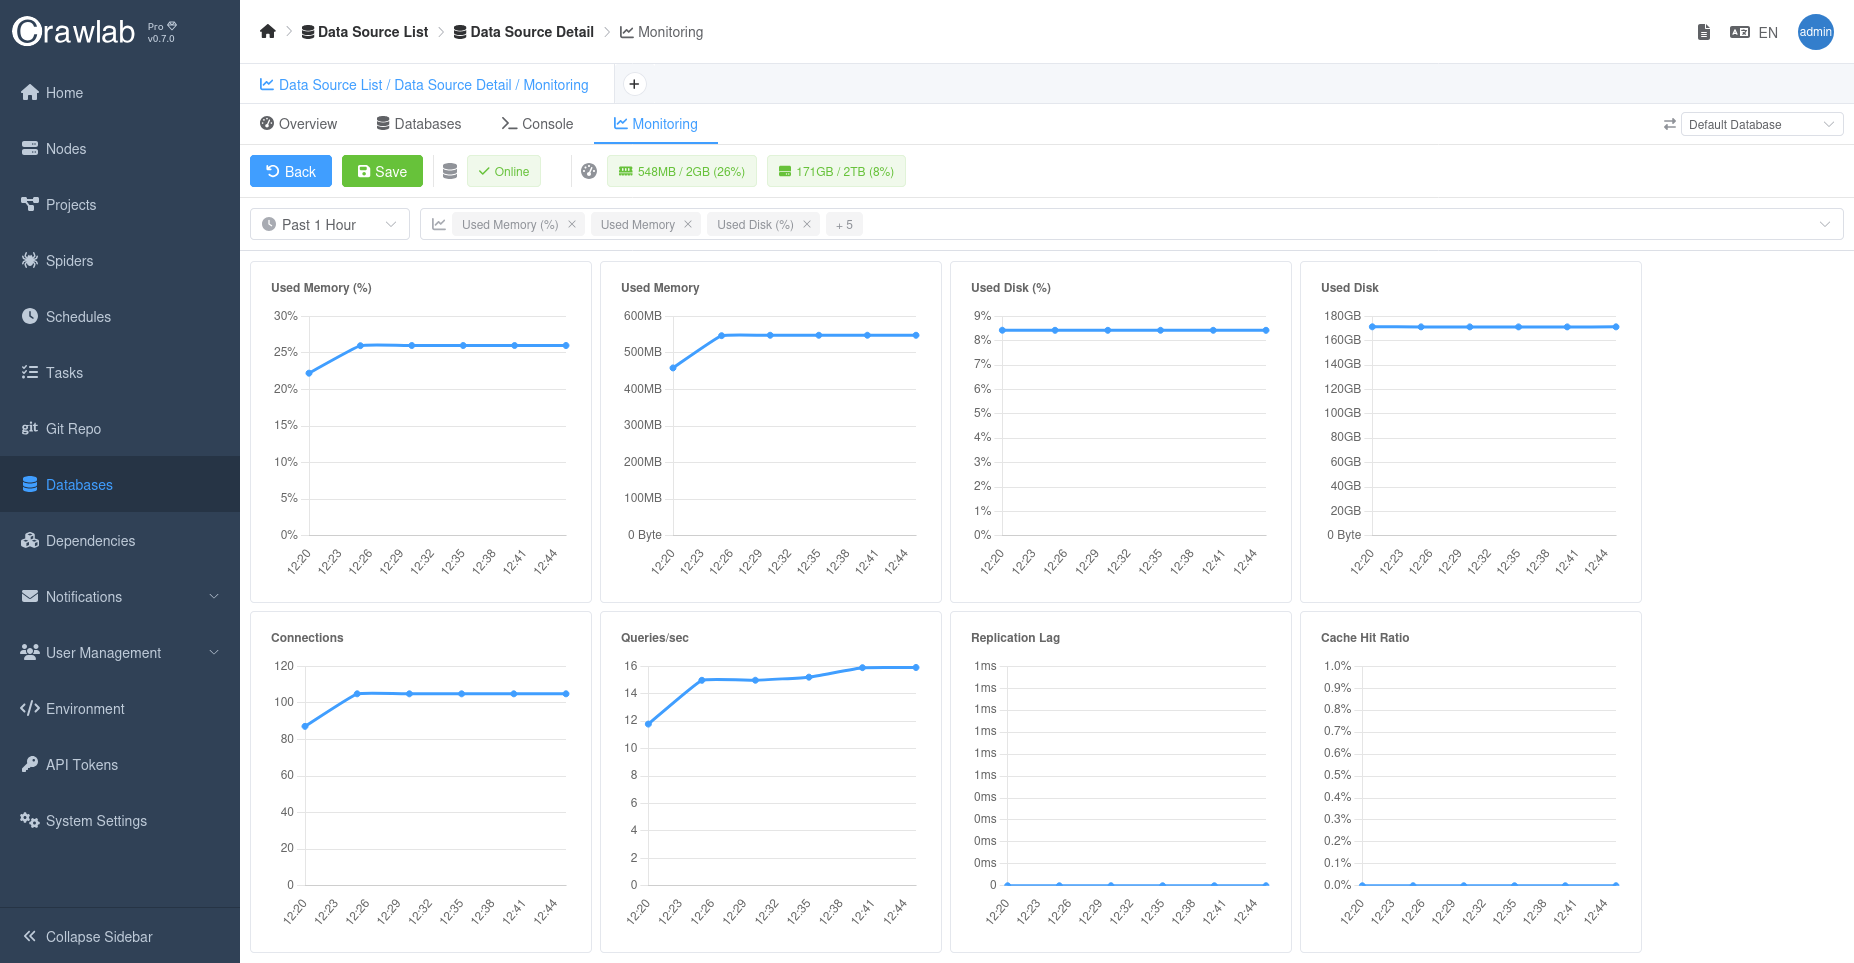
You can monitor performance metrics of a database in the Monitoring tab in the Database detail page.
Notifications
You are strongly recommended to set up alerts for critical metrics to get notified when potential issues occur.
Crawlab provides real-time alerts for critical metrics, helping teams stay ahead of potential issues.
Refer to Notification Alerts for more details.
Best Practices
- Monitor Node and Database Performance: Regularly check the node and database performance metrics to identify potential bottlenecks.
- Optimize Task Distribution: Adjust task distribution strategies to balance workload across nodes.
- Monitor Task Execution: Track task execution patterns to identify and resolve performance issues.
- Set up alerts: Set up alerts for critical metrics to get notified when potential issues occur.